Master thesis: Deep learning to estimate power output from breathing
Yesterday I presented and defended my master thesis in "Computational Science: Physics" at the Physics Department at the University of Oslo. The title of my thesis is Deep learning to estimate power output from breathing.
The main goal of the project was to use recordings of breathing patterns to estimate how much power (measured in watts) a person generates during cycling. The motivation was to investigate whether breathing data can provide a universal and portable way of estimating physical effort/exercise intensity.
Popular methods of measuring exercise intensity include heart rate, speed measurements and power meters. Let me why we want to investigate an alternative to these traditional ways of effort gauging:
- Heart rate has the drawback of not being as reactive as breathing is when we increase exercise intensity. It also drifts upwards during a workout, even though the workload remains constant.
- Speed measurements (typically using GPS) are also very common, but they can't really be used as a standalone measure of intensity when used in hilly terrain or when the external conditions dictate the speed.
- Power meters, while giving perhaps the most accurate measure of hard you're working during exercise, are currently mostly limited to cycling and indoor ergometers, where it's possible to use force sensors to measure power output.
Because of this, we wanted to see whether breathing data could be used to estimate how much power a person outputs during exercise! So to summarize, the main goal of the project was to find a relationship between these parameters:
- INPUT: Respiratory inductive plethysmography (breathing)
- OUTPUT: Power (physical effort)
The breathing data consisted of measurements of how the ribcage and abdomen expands and contracts (this type of measurement is called respiratory inductive plethysmography, or RIP). I used two of these sensors, as shown in the picture below.
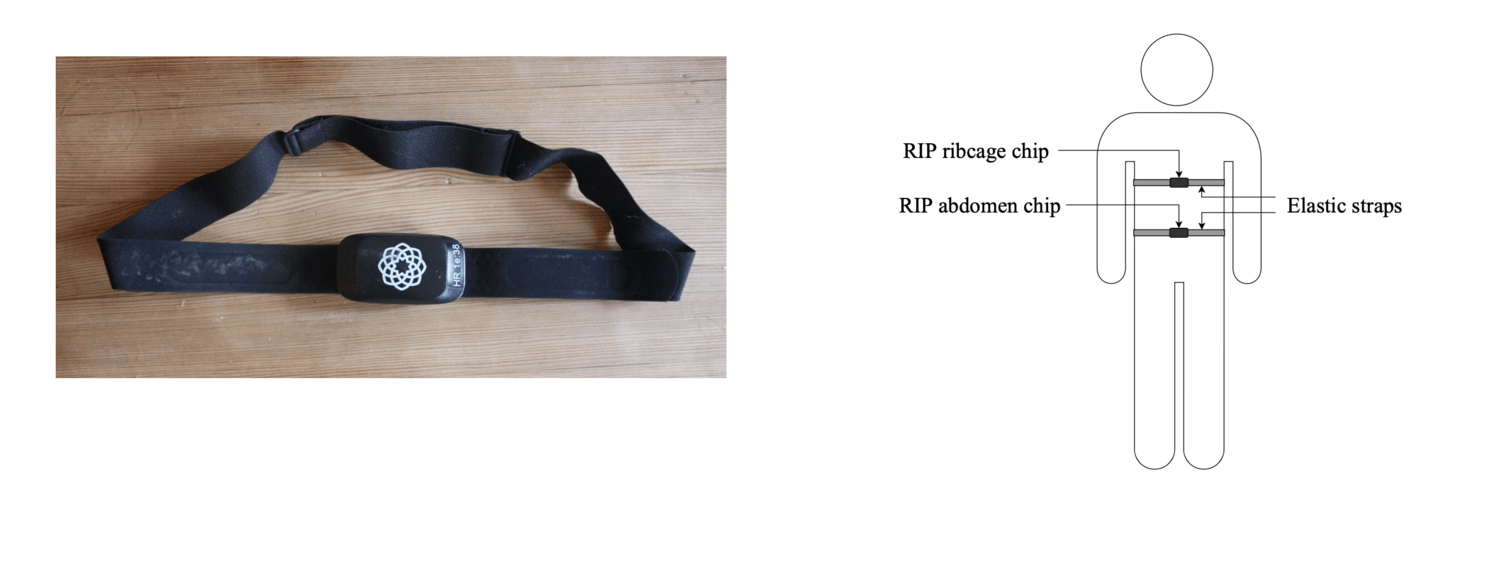 Image of the RIP sensor to the left, and a figure showing how a person would
wear two of the sensors the to right.
Image of the RIP sensor to the left, and a figure showing how a person would
wear two of the sensors the to right.
In order to find the relationship between breathing data and power output, I used neural networks, which is a type of machine learning.
I collected data from myself (it's fantastic to take a workout and be able to say "I'm just working on my thesis"), by recording RIP data, heart rate and power output during a series of workouts.
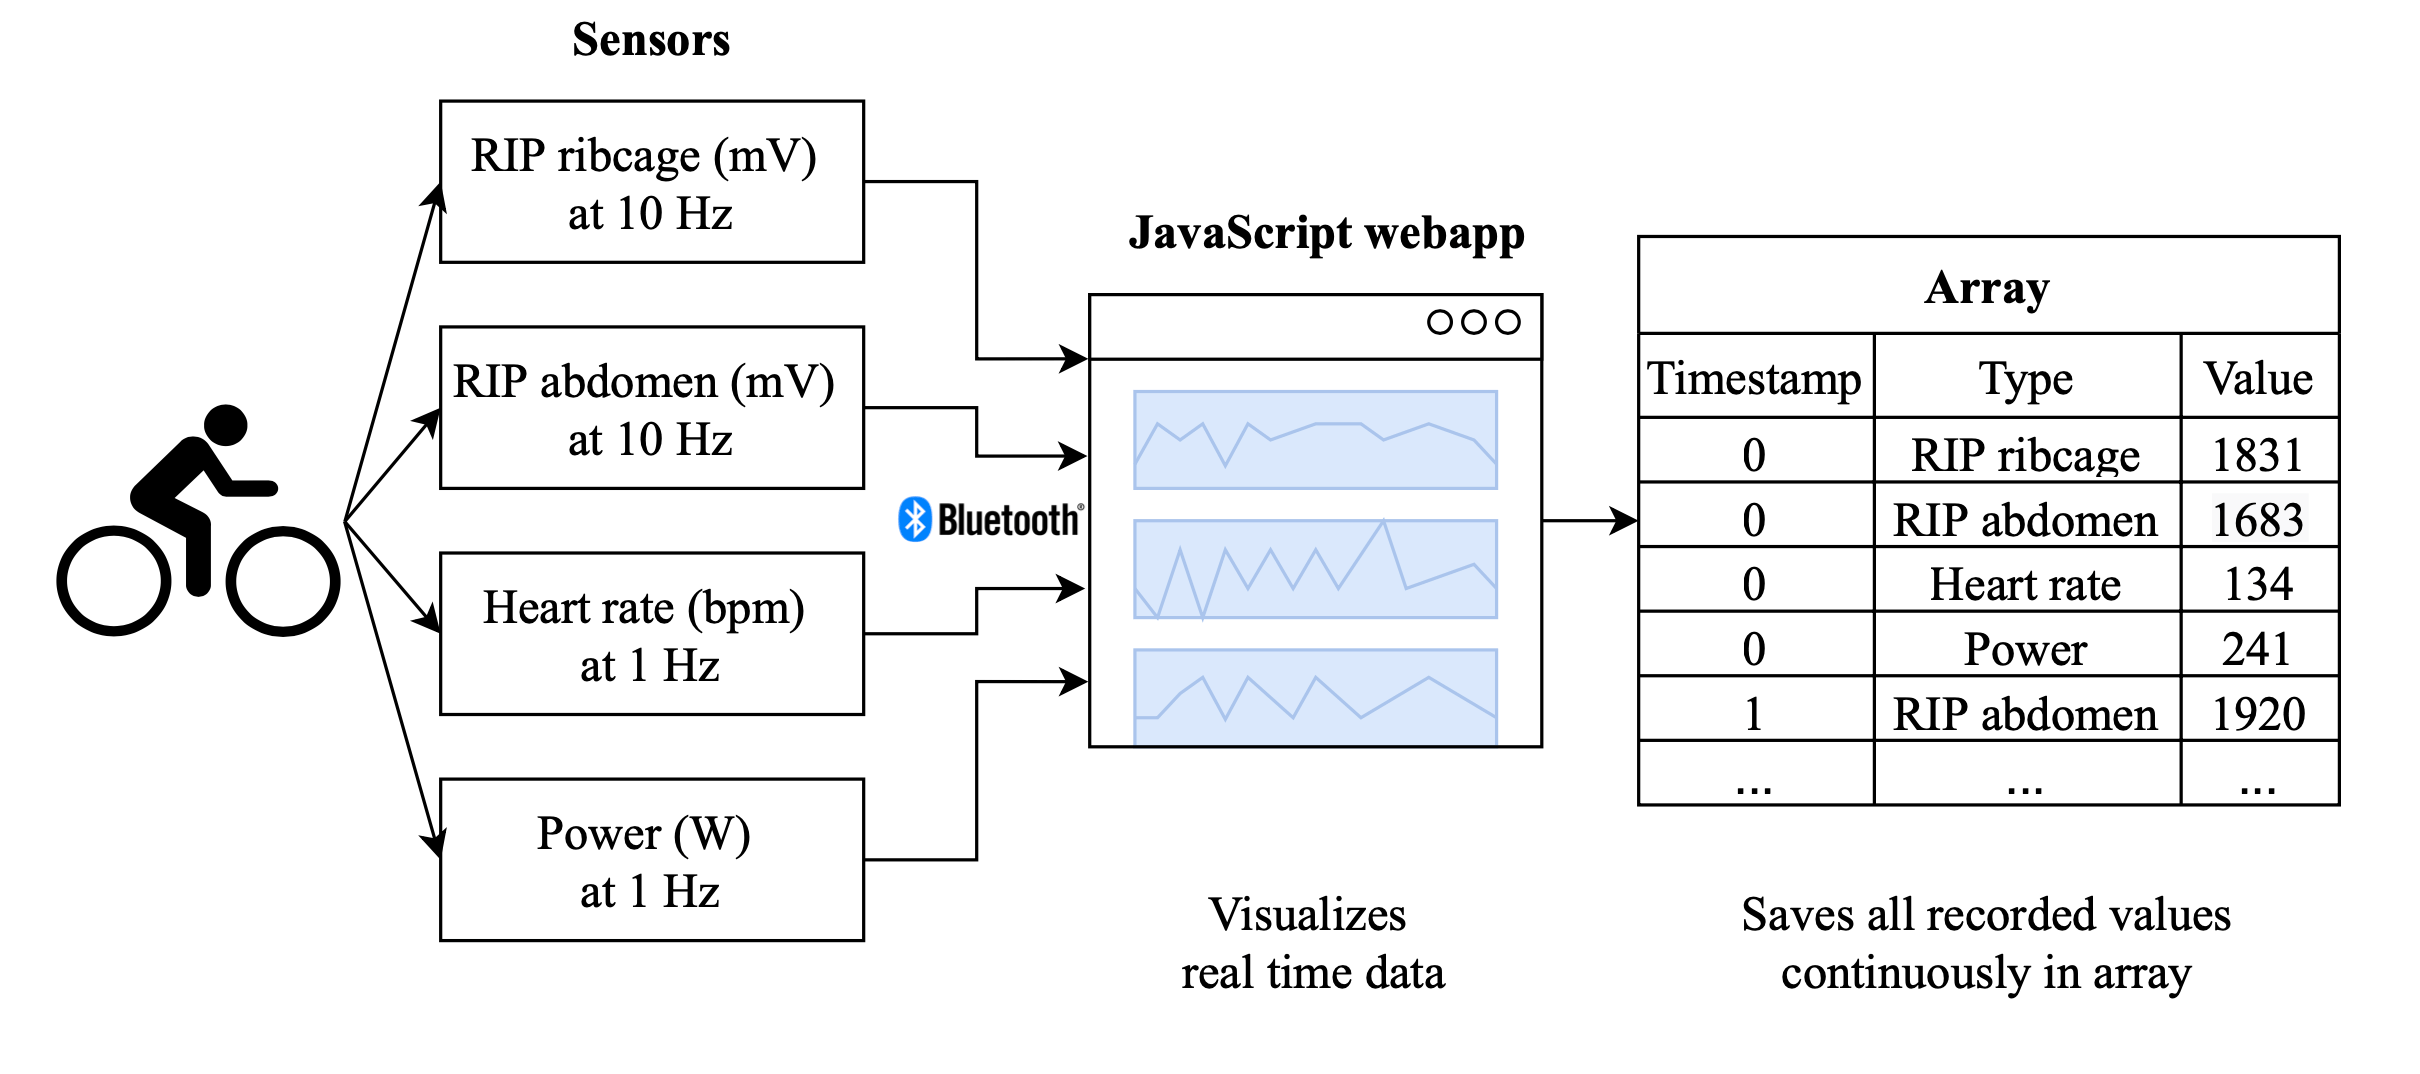 The data flow during data collection.
The RIP sensors contains a strain gauge that converts the mechanical strain on the belt into an electric signal, which means that the sensor outputs values measured in millivolt. An example is shown below, and it's easy to see how the signal increases when the rib cage expands, and decreases when it contracts.
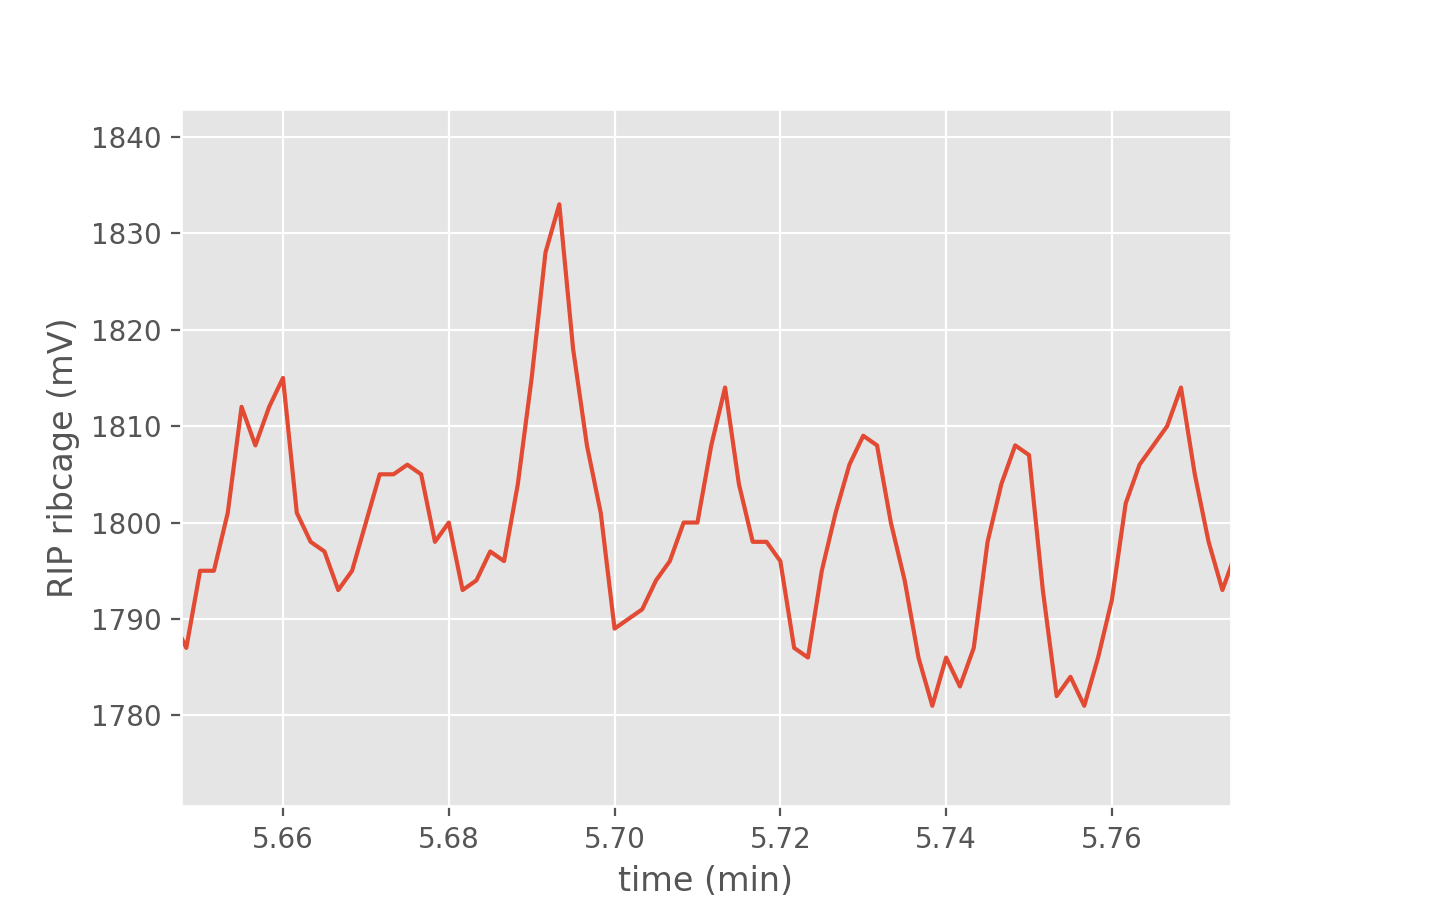 Raw RIP data from the sensor around the ribcage.
Even though it's easy to recognize the breathing pattern when looking at the graph of the RIP signal above, it's not easy to discern how it behaves with regards to exercise intensity, at least not by visual inspection. Below is a graph showing an excerpt from an interval workout. The two RIP signals (in the two top graphs) have some strange behaviour and seem to jump around a bit. This can be a result of belt slippage, or that the person for example is standing up while cycling, reaching for a water bottle, or similar. Hopefully the neural networks can help us see past such irrelevant information in the input data!
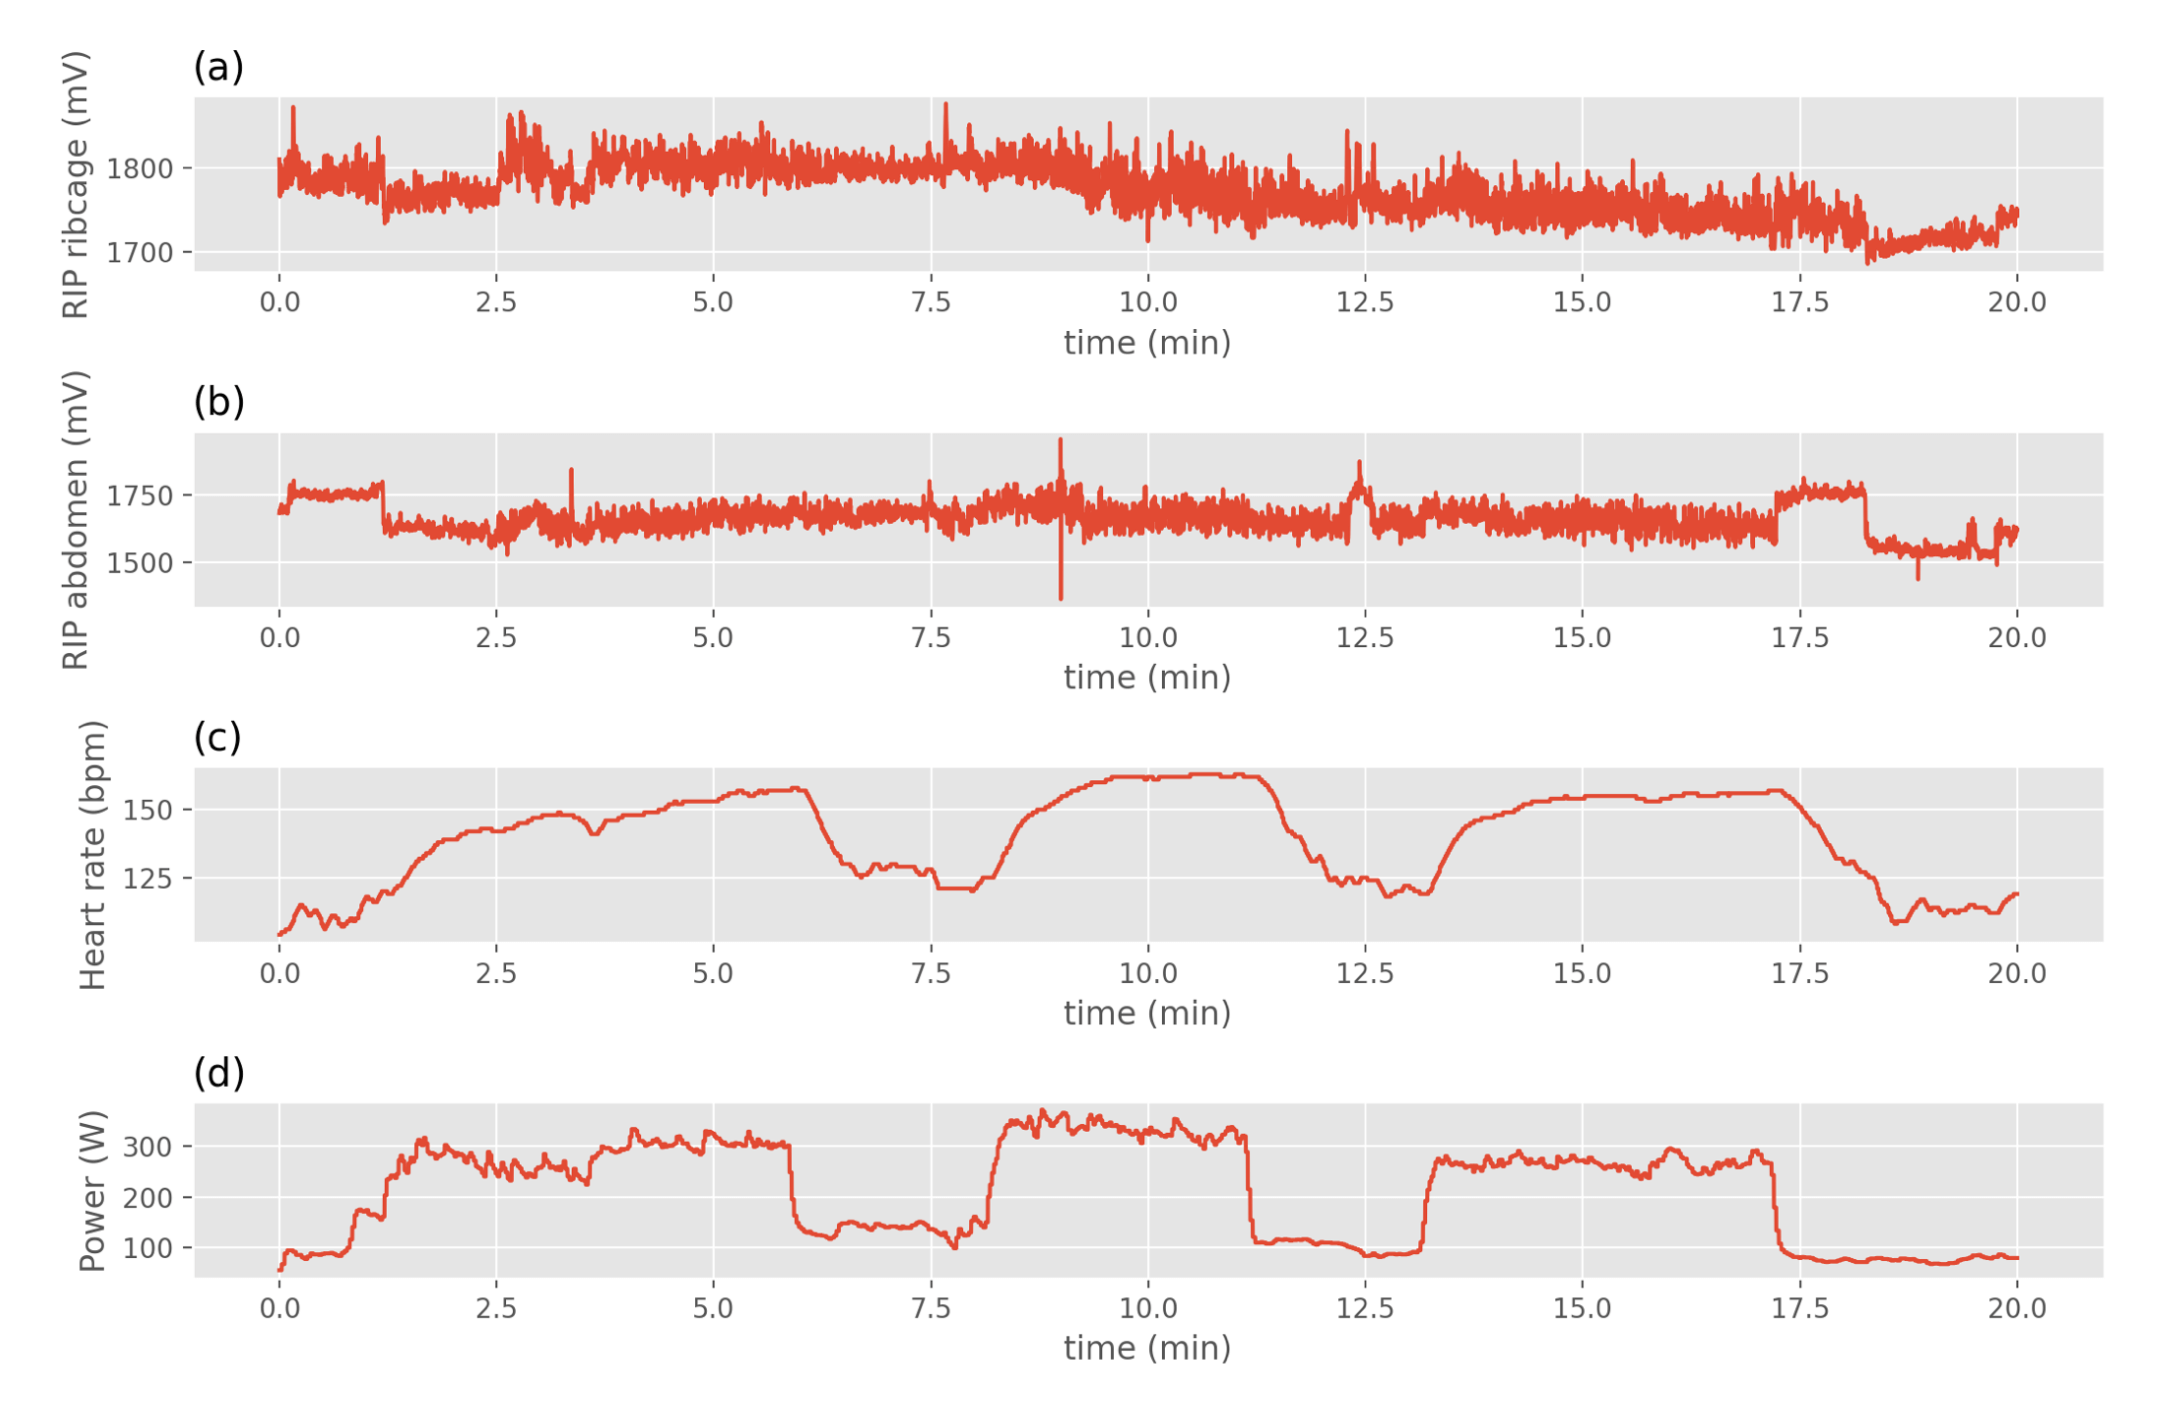 Example of raw data from an interval workout.
I performed many different types of workouts, various types of intervals, steady-state efforts and workouts with ramp and pyramid structure. Some examples are shown below.
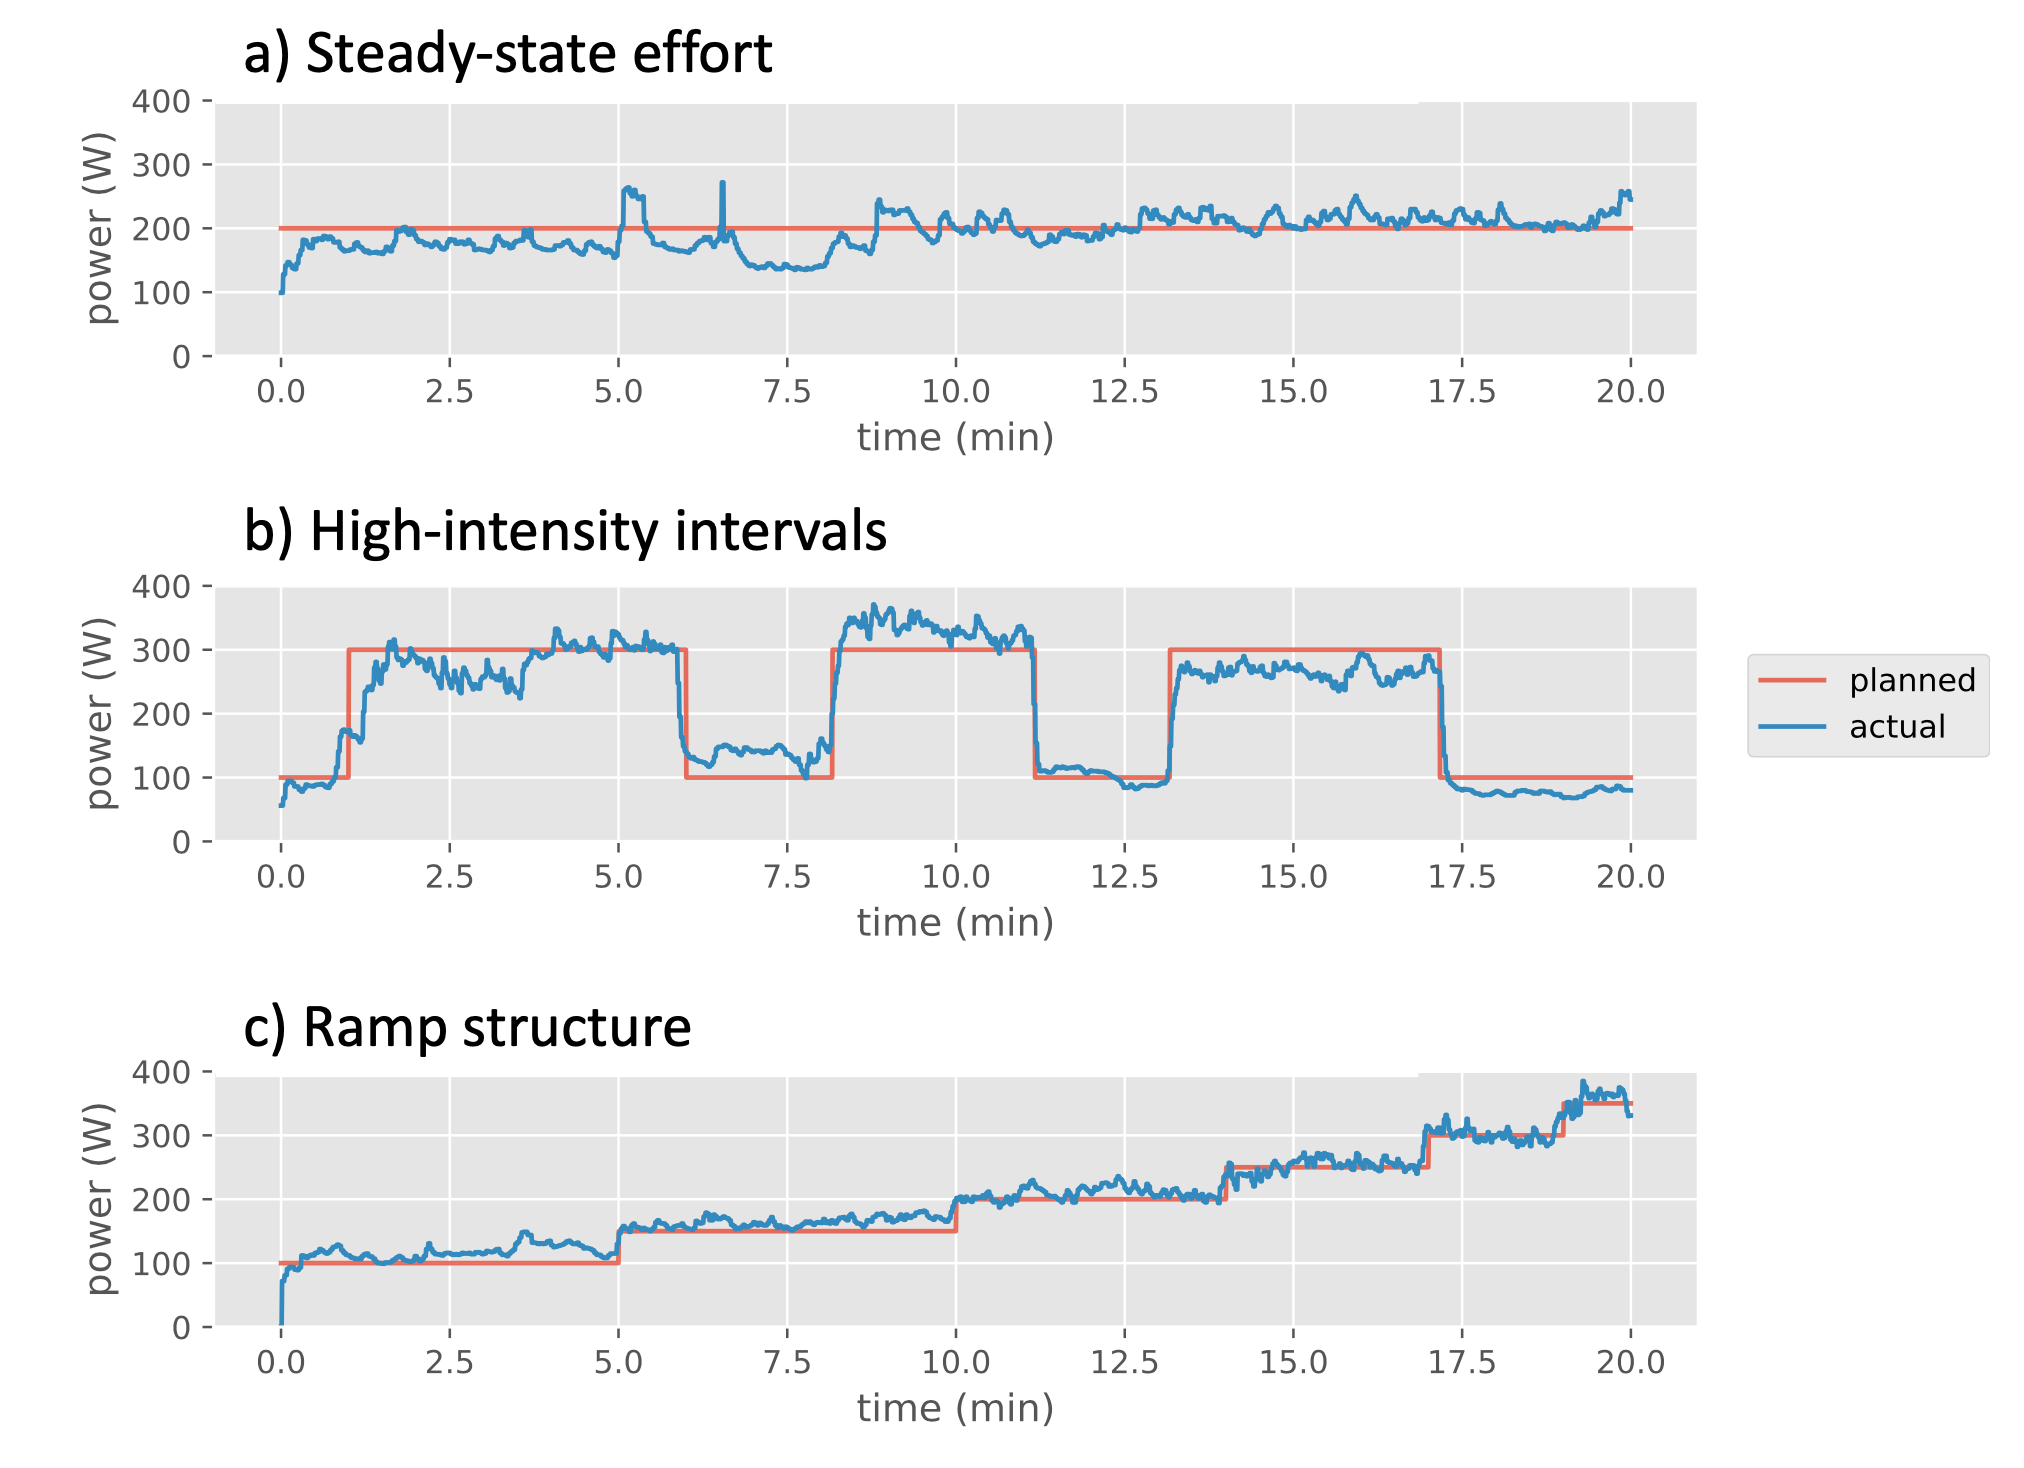 The data set consisted of workouts from mainly three different categories.
In order to enable the neural networks to make the best possible estimations, I needed to extract/engineer/derive (choose the term you feel is most understandable) some features from the raw data. To put it simply: Feature extraction means that I'm trying to find the most important information in the raw data and feed that to the neural network, so it's easier for the neural network to learn the relationship between the input and output data. But this also means that I have to figure out what the most important information is, and in the end, that's what I want the neural network to do... So you could say that it's a sort of collaboration between me and the neural network!
I extracted many types of features, but three of the most important ones are shown in the figure below. To keep this blog post short and sweet, I won't go into the details here.
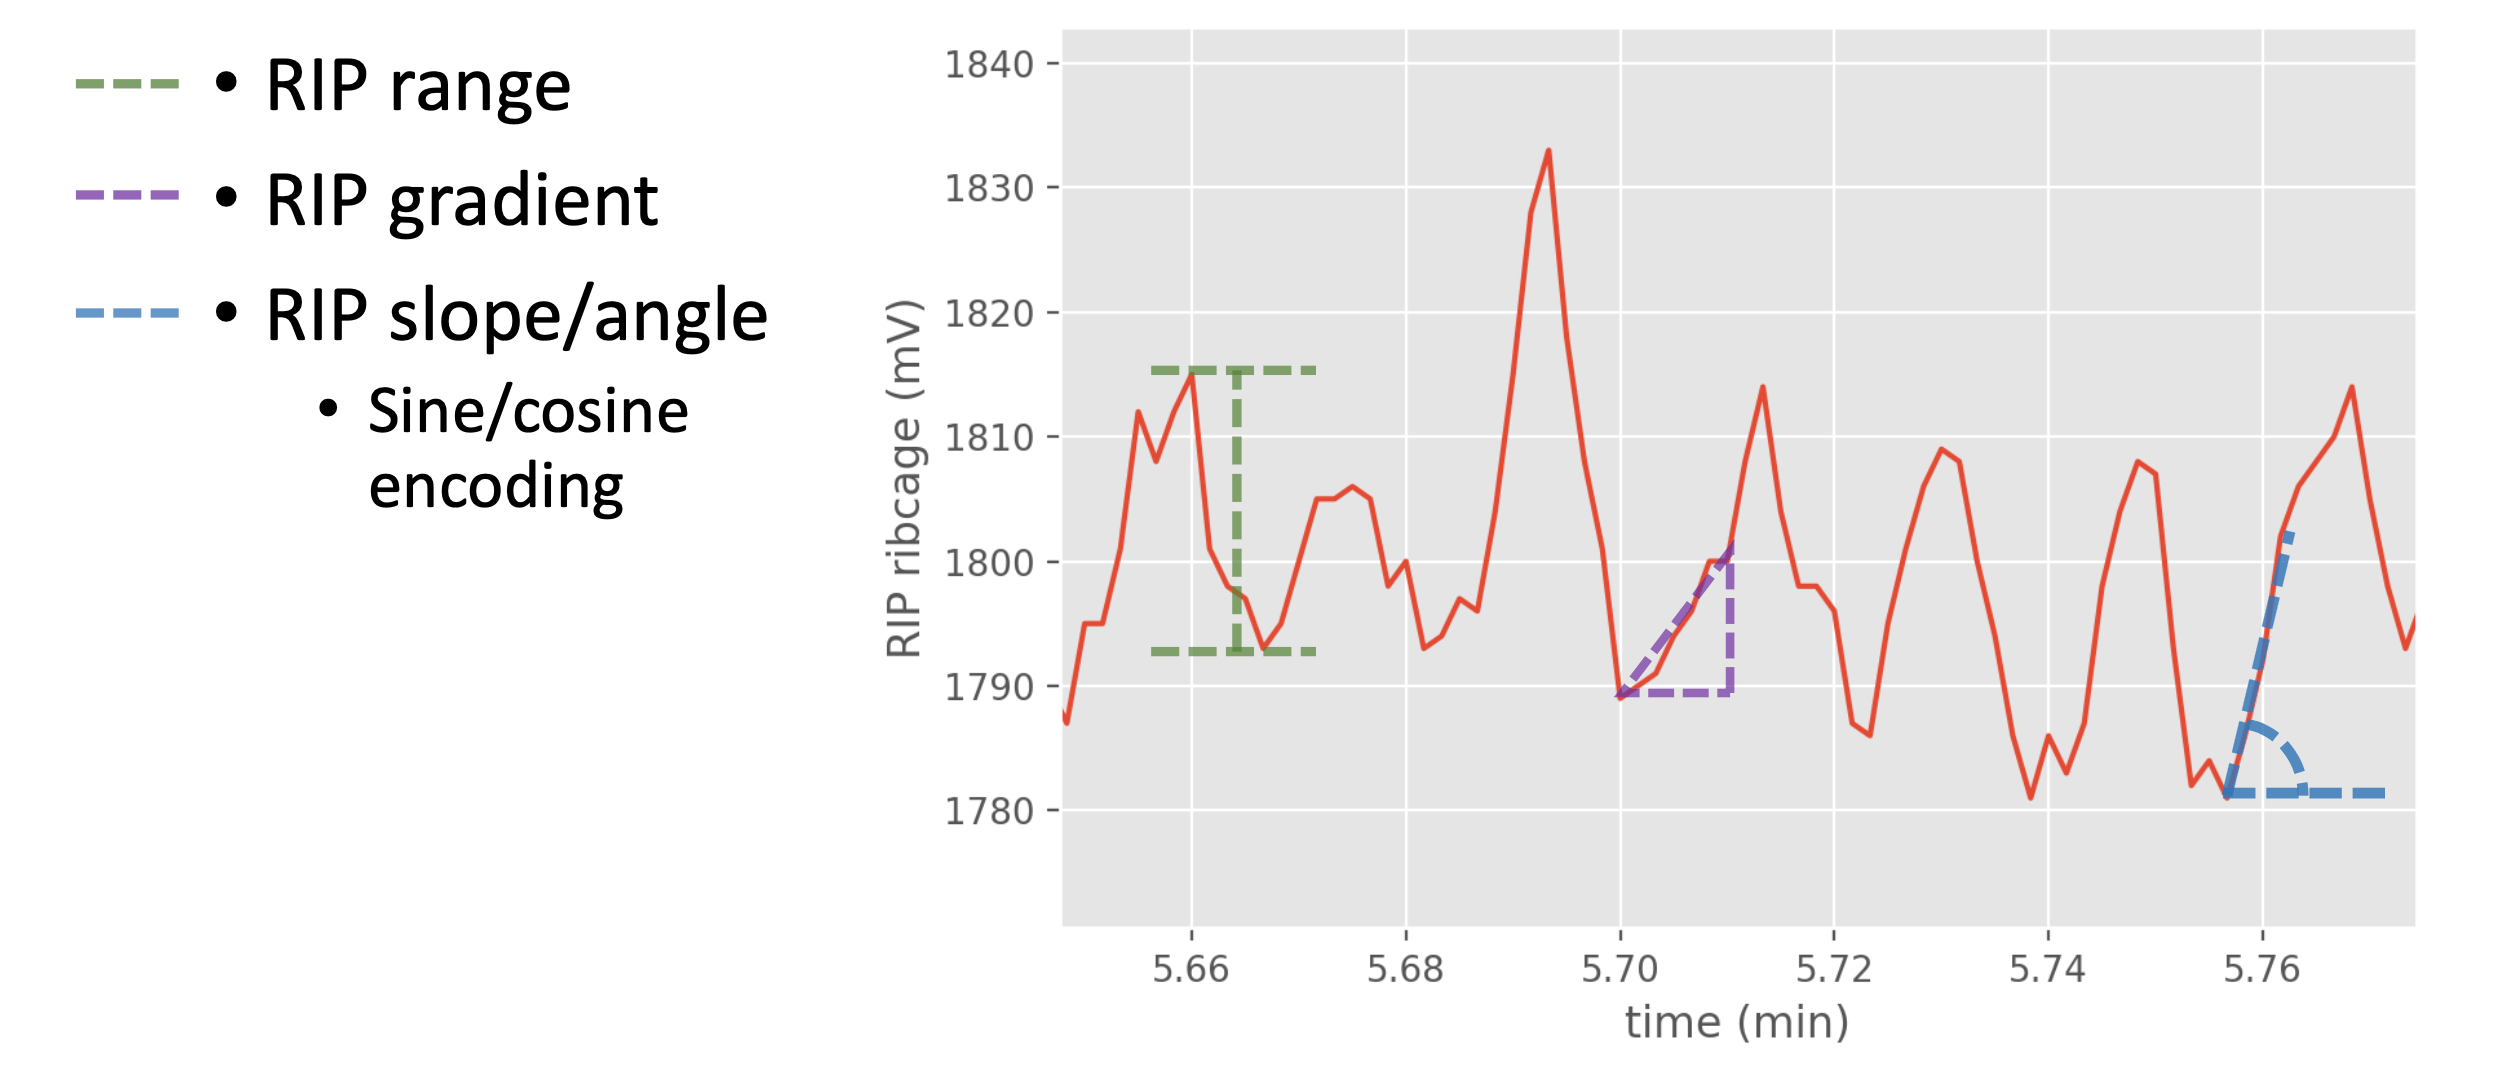 This graph visualizes three of the most important features that a extracted
from the raw data. Read the thesis (link at the end of the post) for more juicy
details!
This graph visualizes three of the most important features that a extracted
from the raw data. Read the thesis (link at the end of the post) for more juicy
details!
My best performing model was obtained by using a convolutional neural network, and when testing the model on unseen data it got an average error of 20%. That may sound like a lot, but the average error is affected by the fact that the model is not very good at estimating power values above 400 watts, since most of the data set contained power values below that (which is also where most of us spend most of the time when cycling).
An example of how the power output estimation by the model looks like is shown below. The output signal (in blue) is quite noisy, but the model is able to estimate approximately the correct power level most of the time.
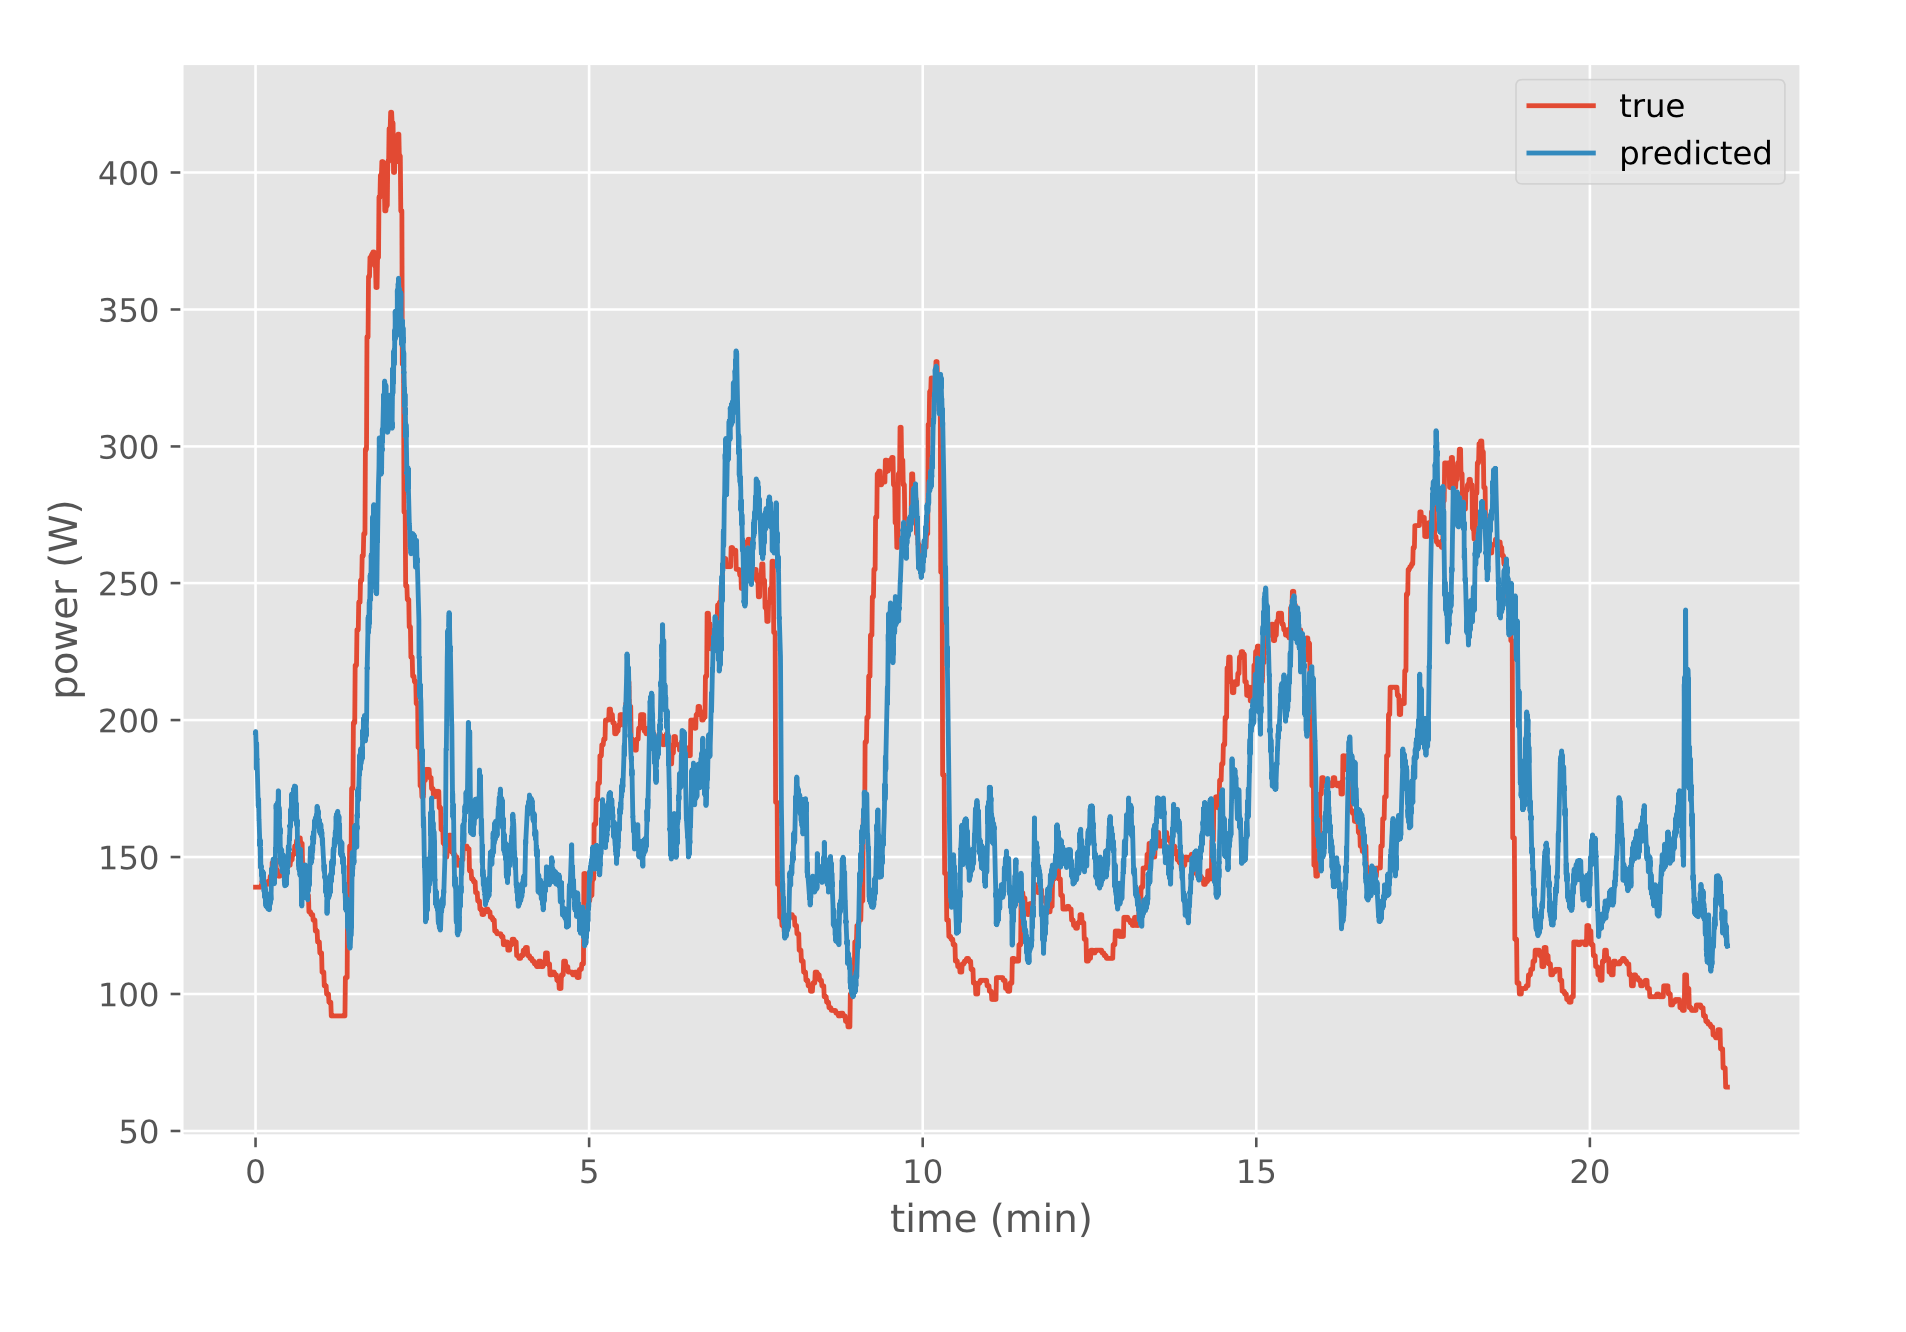 Example of power output estimation, using extracted features from the raw
data (the blue line shows the "predicted" values, which in this case is
analogous to "estimated".
Example of power output estimation, using extracted features from the raw
data (the blue line shows the "predicted" values, which in this case is
analogous to "estimated".
As a comparison, take a look at how the model performs when using only the raw data, without any extracted features (spoiler alert: Not well at all)!
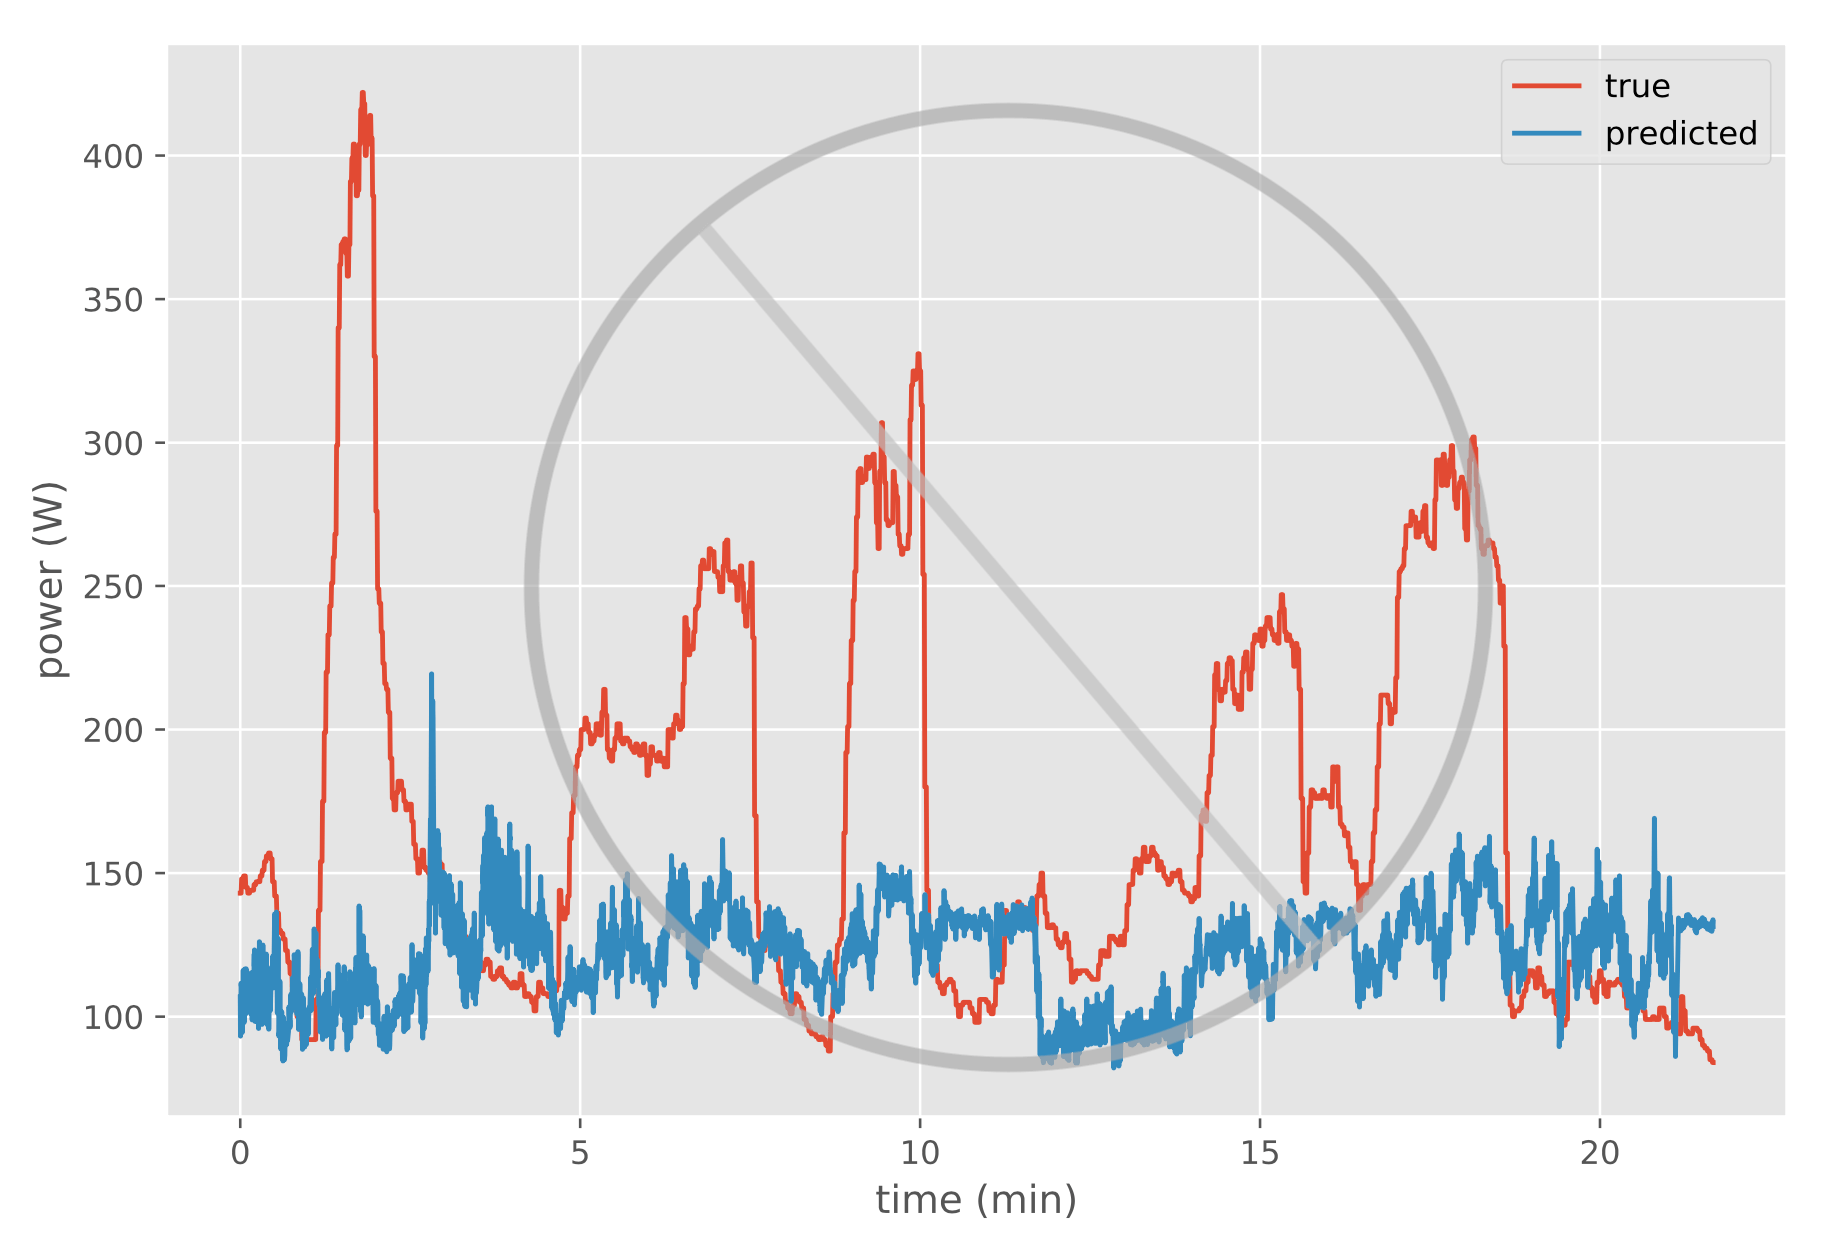 To emphasize how important feature extraction is, here is an example of power
output estimation using only raw data.
To emphasize how important feature extraction is, here is an example of power
output estimation using only raw data.
Conculsion:
- Deep learning shows promising results for estimating power output from breathing data.
- The results of this thesis enables a non-invase, portable way of estimating physical effort.
- Future research should aim at study a larger and more diverse data set, collected from multiple subjects of various age, height, fitness level etc.
If you have some questions or thoughts about my thesis, or about the subject in general, please send me an e-mail on erikjohannes@protonmail.com!
Here are some links to learn more about the research project: